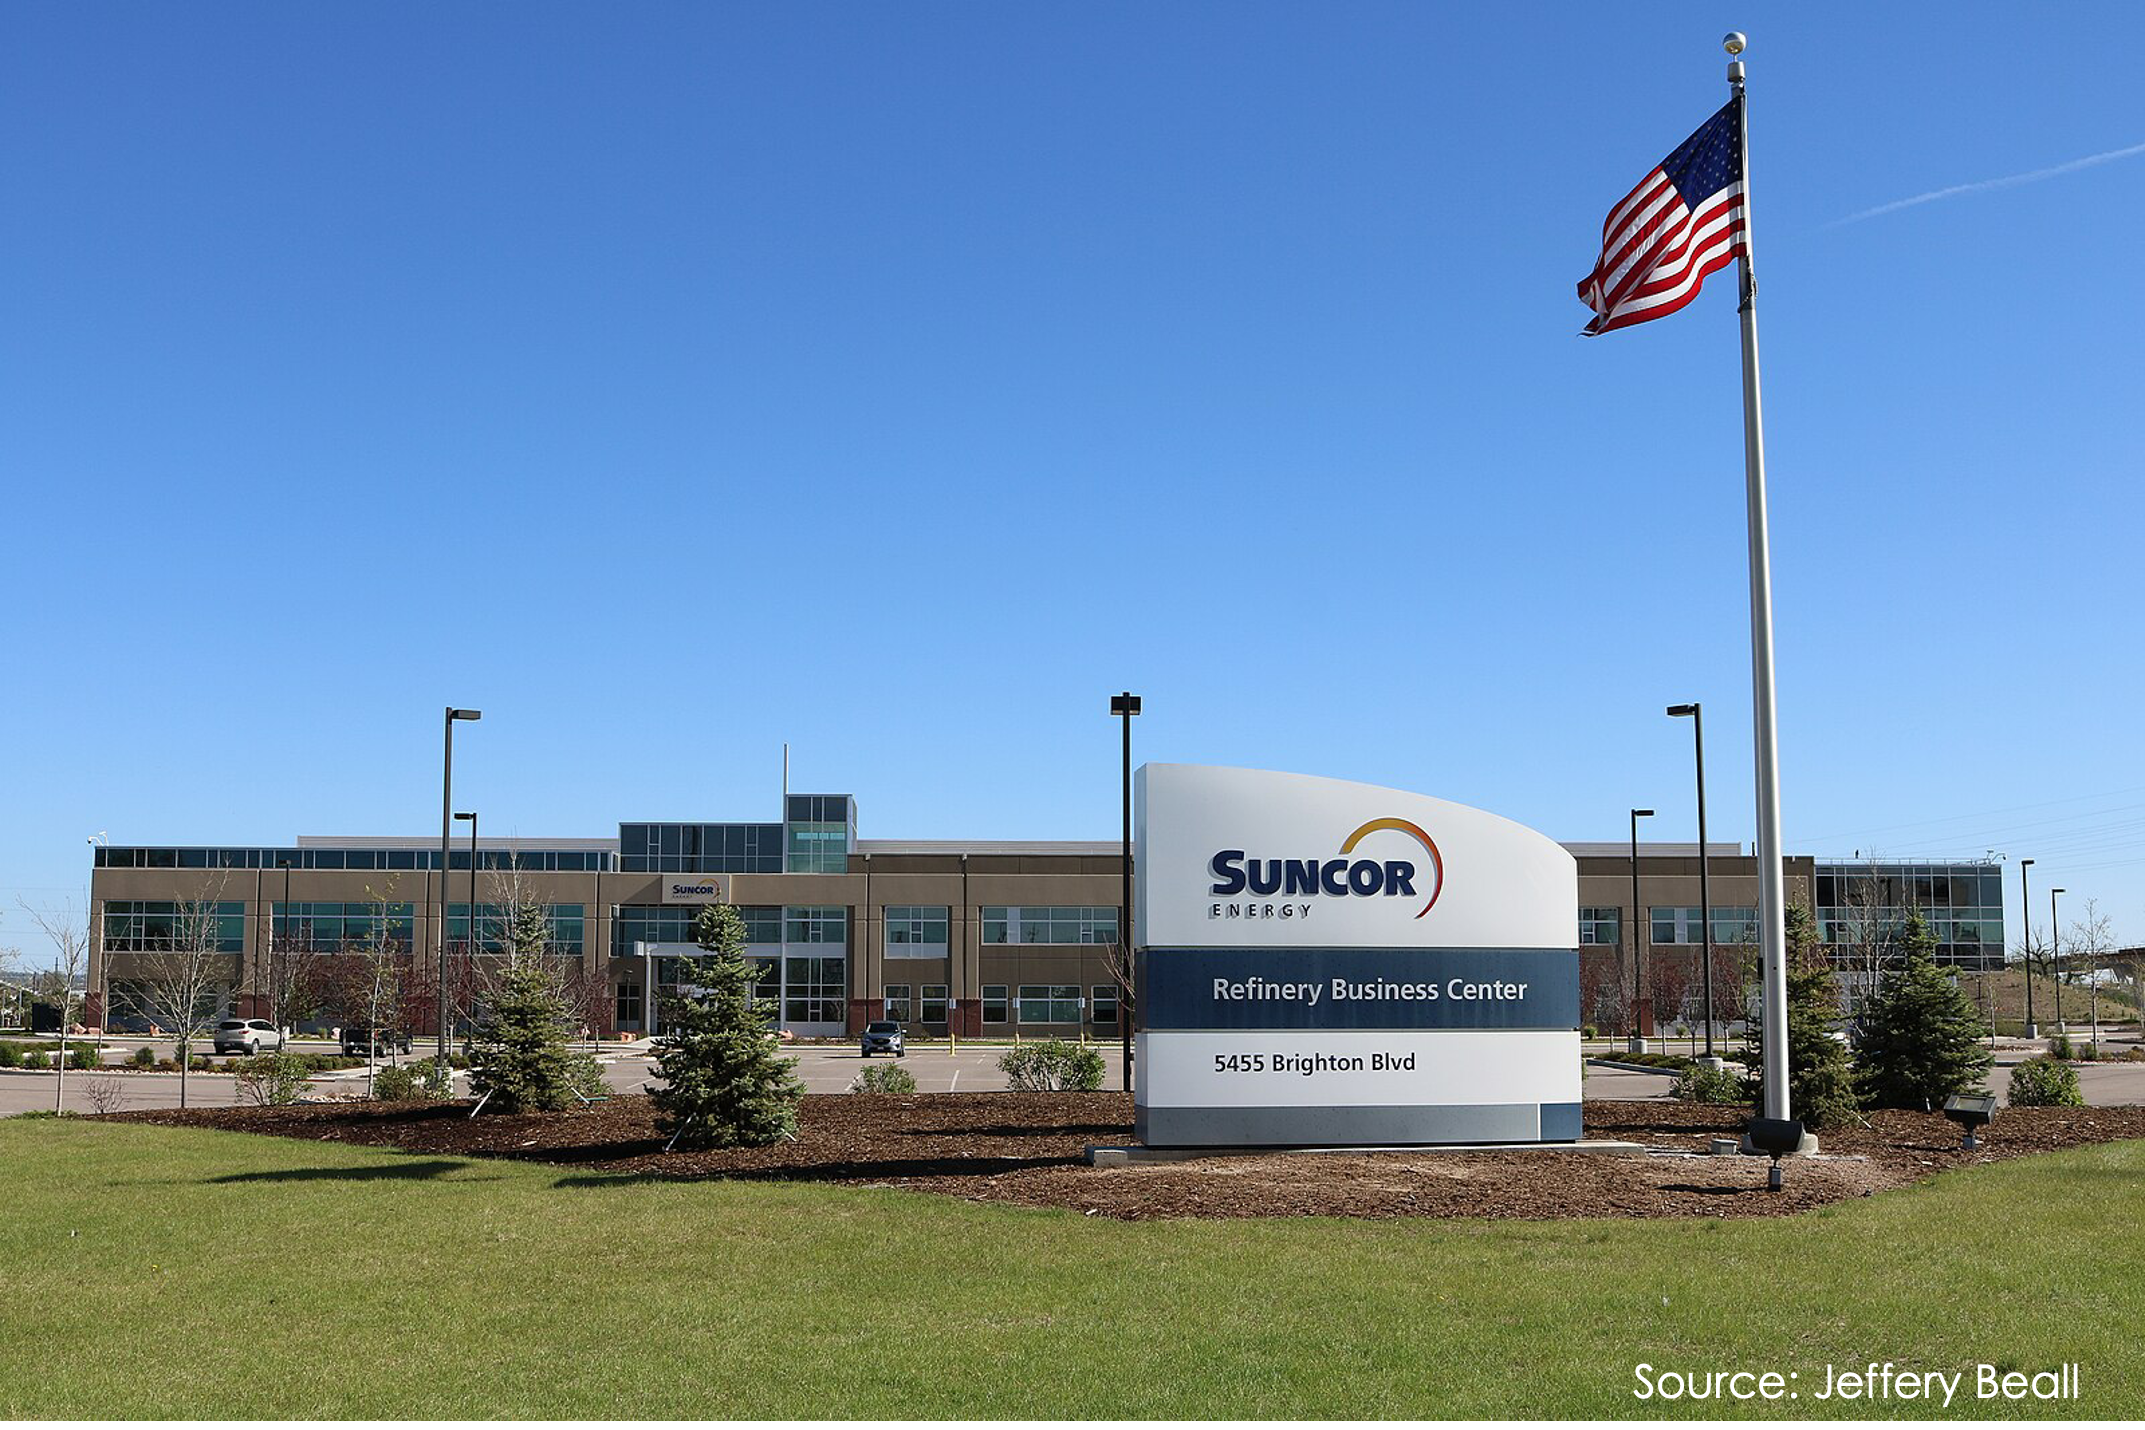
| Imagery Source: Wikimedia Commons/Jeffery Beall |
| Information Source: NewsFile Corp |
| Suncor Energy (TSX: SU) (NYSE: SU) |
| First Quarter Highlights |
- Generated over $3.0 billion in adjusted funds from operations and $1.9 billion in free funds flow.
|
- Returned $1.5 billion to shareholders, with $750 million in share repurchases and $705 million in dividends.
|
- Upstream production of 853,000 barrels per day (bbls/d), the highest first quarter in company history.
|
- Refining throughput of 483,000 bbls/d, the highest first quarter in company history.
|
- Refined product sales of 605,000 bbls/d, the highest first quarter in company history.
|
- Exceptional asset utilisation with upgraders at 102% and refineries at 104%.
|
| "Our strong first quarter financial and operating performance maintained the momentum established in 2024, as we remain laser-focused on continuing to deliver safe, reliable, and cost-effective operations. Our results demonstrate this commitment, as represented by record performance across both the upstream and downstream," said Rich Kruger, Suncor's President and Chief Executive Officer. "Our focus on the fundamentals, integrated business model, and continually improving cost structure enables us to deliver free funds flow and shareholder value despite the current volatile business environment." |
- Suncor's adjusted operating earnings were $1.629 billion ($1.31 per common share) in the first quarter of 2025, compared to $1.817 billion ($1.41 per common share) in the prior year quarter, with the decrease primarily as a result of lower upstream sales volumes due to a build in inventory as production remained strong in the quarter, partially offset by higher refined products sales volumes with record first quarter refining throughput. Higher Oil Sands price realisations, which benefited from narrower differentials compared to the prior year quarter, were mostly offset by lower downstream benchmark crack spreads. The Canadian dollar also weakened against the U.S. dollar in the current quarter, resulting in a foreign exchange loss on working capital items compared to a larger gain in the prior year quarter, but a benefit to upstream price realisations.
|
- Net earnings were $1.689 billion ($1.36 per common share) in the first quarter of 2025, compared to $1.610 billion ($1.25 per common share) in the prior year quarter. In addition to the factors impacting adjusted operating earnings, net earnings for the first quarter of 2025 and the prior year quarter were impacted by the reconciling items shown in the table above.
|
- Adjusted funds from operations were $3.045 billion ($2.46 per common share) in the first quarter of 2025, compared to $3.169 billion ($2.46 per common share) in the prior year quarter, and were primarily influenced by the same factors impacting adjusted operating earnings, excluding depreciation, depletion and amortization (DD&A) expense.
|
-
- Oil Sands adjusted funds from operations increased by $367 million compared to the prior year quarter, primarily due to higher price realisations and strong production, partially offset by a build of inventory in the latter part of the quarter.
|
-
- Exploration and production (E&P) adjusted funds from operations decreased by $137 million compared to the prior year quarter, primarily due to an inventory build related to the timing of cargo sales as production increased compared to the prior year quarter.
|
-
- Refining and Marketing (R&M) adjusted funds from operations decreased by $404 million compared to the prior year quarter, primarily due to lower benchmark crack spreads, partially offset by increased refinery production and sales volumes.
|
- Cash flow provided by operating activities, which includes changes in non-cash working capital, decreased to $2.156 billion ($1.74 per common share) in the first quarter of 2025, compared to $2.787 billion ($2.16 per common share) in the prior year quarter.
|
- Operating, selling and general (OS&G) expenses decreased to $3.297 billion in the first quarter of 2025, compared to $3.440 billion in the prior year quarter, primarily due to lower upstream sales volumes and a corresponding decrease in operating expenses as inventory was built in the latter part of the quarter, partially offset by increased mining and maintenance activity, and higher commodity input volumes.
|
|
Total Oil Sands bitumen production increased to 937,300 bbls/d in the first quarter of 2025, compared to 932,100 bbls/d in the prior year quarter, and included record first quarter Firebag production. |
- The company's net synthetic crude oil (SCO) production was 536,600 bbls/d in the first quarter of 2025, compared to a record of 545,000 bbls/d in the prior year quarter and included the second highest ever quarterly upgrader utilization of 103% at Oil Sands Base and record first quarter upgrader utilization of 100% at Syncrude.
|
- Non-upgraded bitumen production increased to 254,300 bbls/d in the first quarter of 2025, compared to 240,000 bbls/d in the prior year quarter, primarily due to higher upgrader availability in the prior year quarter.
|
- E&P production increased to 62,300 bbls/d in the first quarter of 2025, compared to 50,300 bbls/d in the prior year quarter, primarily due to increased production at Terra Nova and Hebron.
|
- Strong downstream operating performance resulted in record first quarter refinery throughput of 482,700 bbls/d and refinery utilisation of 104%, compared to 455,300 bbls/d and 98%, respectively, in the prior year quarter, which was also impacted by higher planned maintenance activities.
|
- Downstream achieved record first quarter refined product sales of 604,900 bbls/d in the first quarter of 2025, compared to 581,000 bbls/d in the prior year quarter, with the increase primarily due to higher refinery throughput and the benefit of the company's extensive sales and retail network.
|
| Corporate and Strategy Updates |
- Production resumes at White Rose. Production safely restarted at White Rose in the first quarter, with production returning to normal levels in the second quarter.
|
| Corporate Guidance Updates |
| There have been no changes to the 2025 corporate guidance ranges previously issued on December 12, 2024. |
| For further details and advisories regarding Suncor's 2025 corporate guidance, see www.suncor.com/guidance. |
| Non-GAAP Financial Measures |
| Certain financial measures in this news release - namely adjusted funds from operations, adjusted operating earnings, free funds flow and net debt, and related per share or barrel amounts - are not prescribed by GAAP. These non-GAAP financial measures are included because management uses the information to analyse business performance, leverage and liquidity, as applicable, and it may be useful to investors on the same basis. These non-GAAP financial measures do not have any standardised meaning and, therefore, are unlikely to be comparable to similar measures presented by other companies. Therefore, these non-GAAP financial measures should not be considered in isolation or as a substitute for measures of performance prepared by GAAP. Except as otherwise indicated, these non-GAAP financial measures are calculated and disclosed consistently from period to period. Specific adjusting items may only be relevant in certain periods. |
| Adjusted Operating Earnings |
| Adjusted operating earnings are a non-GAAP financial measure that adjusts net earnings for significant items that are not indicative of operating performance. Management uses adjusted operating earnings to evaluate operating performance because management believes it provides better comparability between periods. Adjusted operating earnings are reconciled to net earnings in the news release above. |
| Adjusted Funds From (Used In) Operations |
| Adjusted funds from (used in) operations is a non-GAAP financial measure that adjusts a GAAP measure - cash flow provided by operating activities - for changes in non-cash working capital, which management uses to analyse operating performance and liquidity. Changes to non-cash working capital can be impacted by, among other factors, commodity price volatility, the timing of offshore feedstock purchases and payments for commodity and income taxes, the timing of cash flows related to accounts receivable and accounts payable, and inventory changes, which management believes reduce comparability between periods. |
| Free Funds Flow |
| Free funds flow is a non-GAAP financial measure that is calculated by taking adjusted funds from operations and subtracting capital expenditures, includingcapitalisedd interest. Free funds flow reflects cash available for increasing distributions to shareholders and reducing debt. Management uses free funds flow to measure the capacity of the company to increase returns to shareholders and to grow Suncor's business. |
| Net Debt and Total Debt |
| Net debt and total debt are non-GAAP financial measures that management uses to analyze the financial condition of the company. Total debt includes short-term debt, current portion of long-term debt and long-term debt (all of which are GAAP measures). Net debt is equal to total debt less cash and cash equivalents (a GAAP measure). |
| For the full document, click the link below |
| Suncor Energy |
| Stay ahead of the curve! Subscribe to InsidEntity for daily updates on all your favourite companies. |
.JPG)