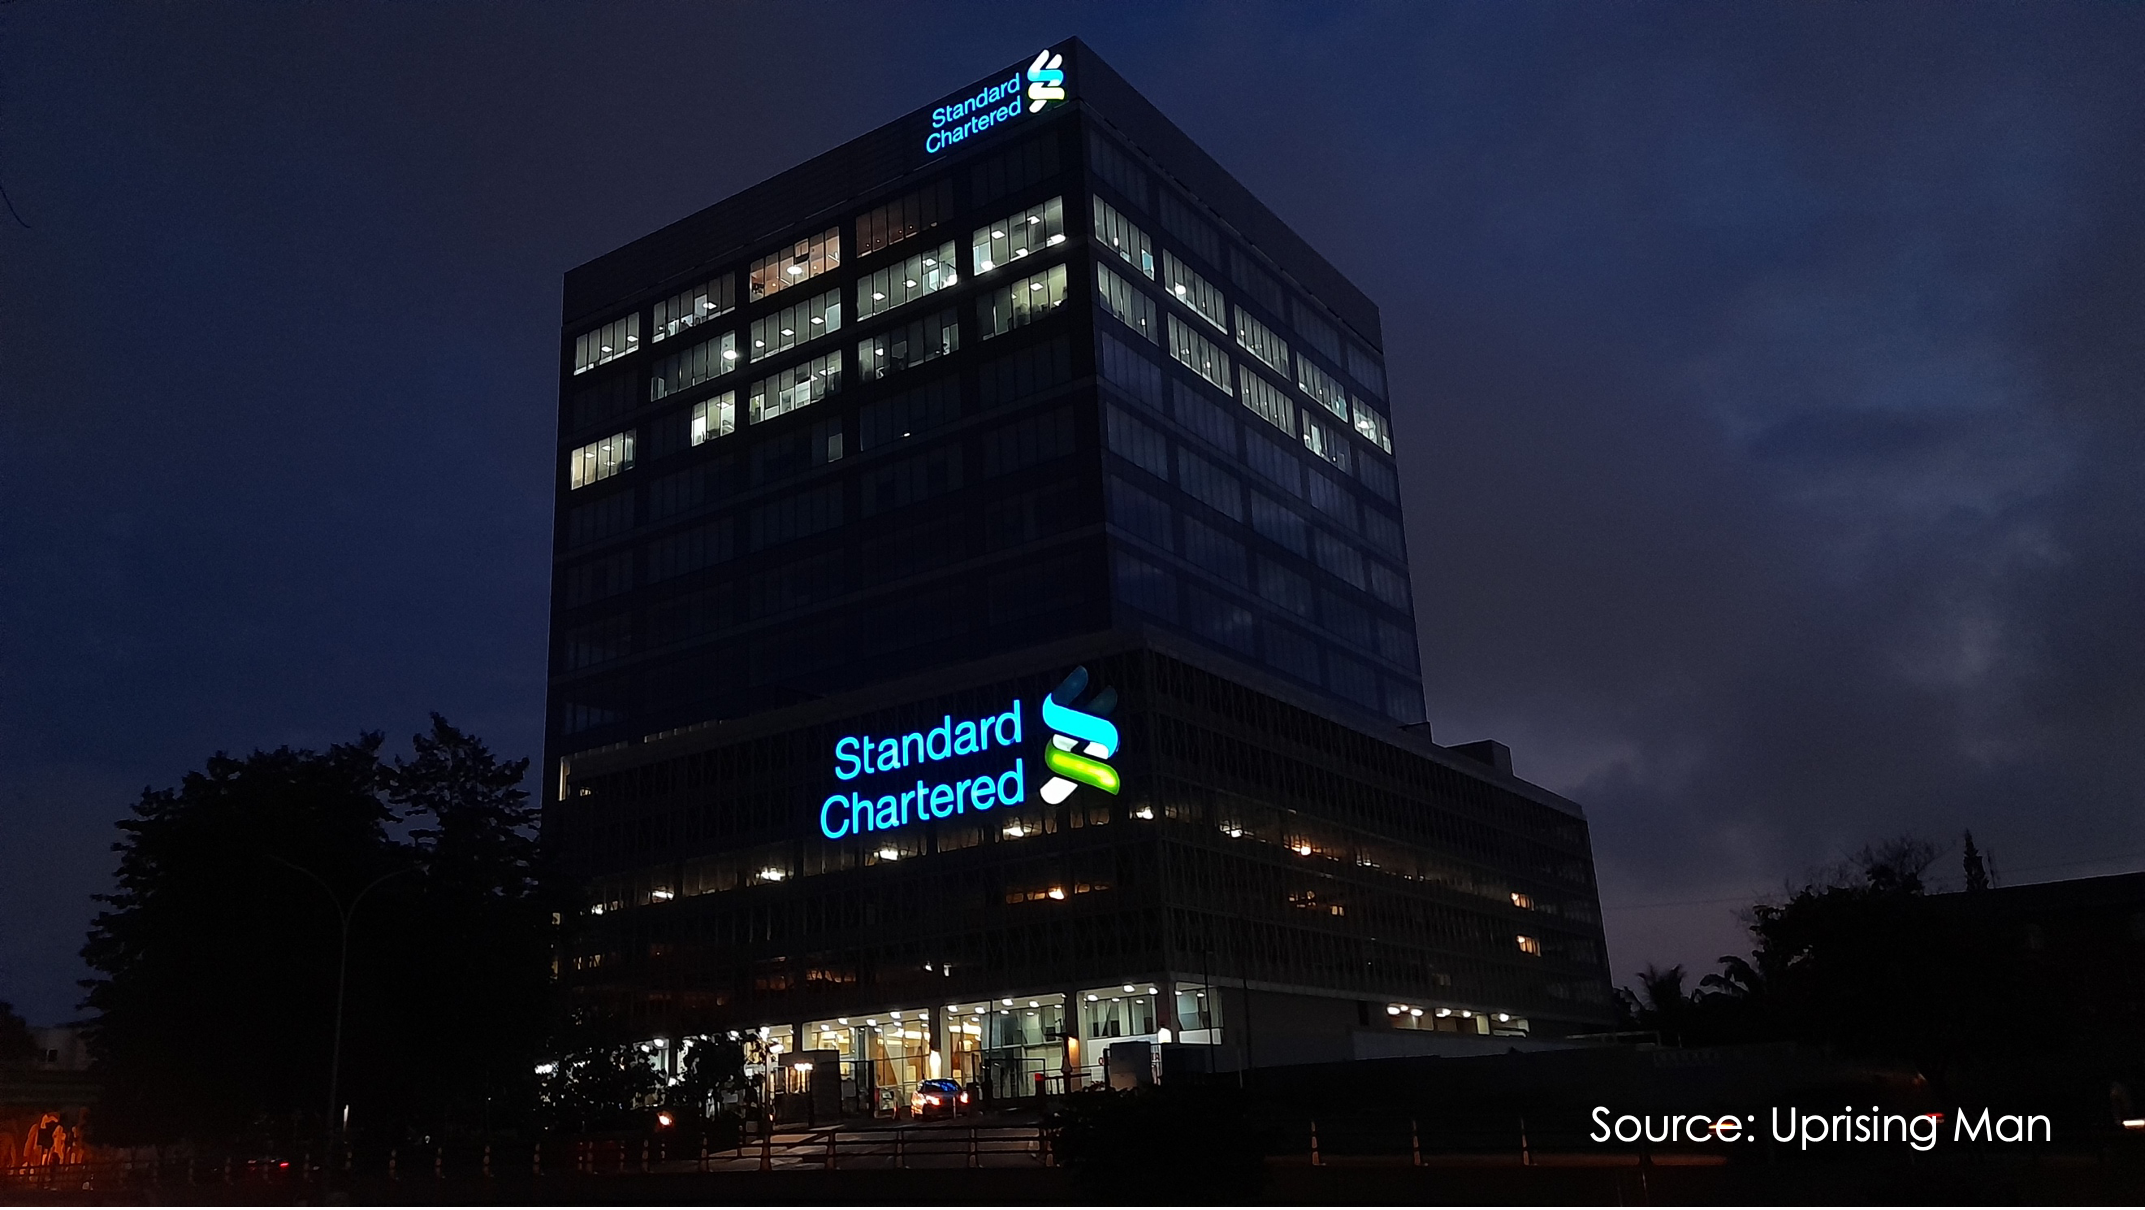
| Imagery Source: Wikimedia Commons / Uprising Man |
| Information Source: Standard Chartered |
| Standard Chartered |
| Bill Winters, Group Chief Executive, said: |
| "We delivered a strong performance in the first quarter of 2025, with earnings per share up 19%, driven by double-digit income growth in Wealth Solutions, Global Markets and Global Banking. The subsequent imposition of trade tariffs has increased global economic and geopolitical complexity, and we remain watchful of the external environment. But our ability to help clients manage their business and wealth across borders in times of volatility reinforces our confidence that we can continue to improve returns. Our presence in structurally high-growth markets across Asia, Africa and the Middle East is key to driving long-term sustainable value for our shareholders, and we remain focused on reinforcing these competitive advantages to drive future growth." |
| Selected information on Q1'25 financial performance with comparisons to Q1'24, unless otherwise stated |
- Operating income up 7% at constant currency (ccy) to $5.4bn, up 12% at ccy excluding notable items
|
-
- Net interest income (NII) up 7% at ccy to $2.8bn
|
-
- Non-NII up 7% at ccy to $2.6bn, up 18% at ccy excluding notable items
|
-
- Wealth Solutions up 28% at ccy, with double-digit growth in both Investment Products and Bancassurance
|
-
- Global Banking up 17% at ccy, driven by higher origination volumes and increased capital markets activity
|
-
- Global Markets up 14% at ccy, with strong performance in both flow and episodic income
|
- Operating expenses up 5% at ccy to $2.9bn, driven by business growth, targeted investments and inflation, partly offset by efficiency savings
|
- Credit impairment charge of $219m up 24%, includes $179m from Wealth & Retail Banking (WRB), with charges mainly from higher interest rates impacting repayments in some unsecured portfolios. There was a $30m charge in Corporate & Investment Banking (CIB) in contrast to net releases in recent quarters
|
-
- Loan-loss rate of 25bps up 2bps
|
- Underlying profit before tax of $2.3bn, up 12% at ccy; reported profit before tax of $2.1bn, up 15% at ccy
|
- Restructuring and other charges of $174m include $73m related to the Fit for Growth programme.
|
- Balance sheet remains strong, liquid and well diversified
|
-
- Loans and advances to customers of $282bn broadly flat since 31.12.24; up 3% on an underlying basis, after adjusting for FX, and Treasury and Global Markets securities-backed lending activities
|
-
- Customer deposits of $491bn up $26bn or 6% since 31.12.24; up 5% at ccy; growth in WRB Term Deposits and CIB CASA
|
- Risk-weighted assets (RWA) of $254bn, up $6.5bn since 31.12.24
|
-
- Market risk RWA up $8.5bn; deployed to help clients capture opportunities
|
-
- Credit risk RWA down $5.0bn; mainly from optimisation activities
|
-
- Operational risk RWA up $3.1bn; mechanically calculated annual one-off increase
|
- The Group remains strongly capitalised
|
-
- Common Equity Tier 1 (CET1) ratio 13.8% (31.12.24: 14.2%) including the full 61 basis points impact of the $1.5bn buyback announced in February 2025
|
- Underlying earnings per share (EPS) increased 9.8 cents to 62.7 cents; reported EPS increased 10.1 cents to 56.6 cents
|
- Tangible net asset value per share of $15.61, up 20 cents QoQ
|
- Return on Tangible Equity (RoTE) of 16.4%, up 120 bps
|
| Guidance |
| 2025 and 2026 guidance remains unchanged as follows: |
|
|
-
- Operating income to increase 5-7% CAGR in 2023-2026 at ccy, excluding the deposit insurance reclassification; currently tracking towards the upper end of the range
|
-
- 2025 growth expected to be below the 5-7% range at ccy, excluding notable items
|
|
|
-
- Operating expenses to be below $12.3bn in 2026 at ccy, including the UK bank levy and the ongoing impact of the deposit insurance reclassification
|
-
- Expense savings of around $1.5bn and cost to achieve of no more than $1.5bn from the Fit for Growth programme – Positive income-to-cost jaws in each year at ccy, excluding notable items
|
|
|
-
- Low single-digit percentage growth in underlying loans and advances to customers and RWA
|
-
- Basel 3.1 day-1 RWA impact expected to be close to neutral
|
-
- Continue to expect the loan-loss rate to normalise towards the historical through-the-cycle 30 to 35bps range
|
|
|
-
- Continue to operate dynamically within the full 13-14% CET1 ratio target range.
|
-
- Plan to return at least $8bn to shareholders, cumulatively from 2024 to 2026
|
-
- Continue to increase the full-year dividend per share over time
|
- RoTE approaching 13% in 2026 and to progress thereafter
|
| “The Group delivered a strong performance in the first quarter of 2025” |
| Summary of financial performance |
| All commentary that follows is on an underlying basis, and comparisons are made to the equivalent period in 2024 on a constant currency basis, unless otherwise stated. Q1 2024 included items totalling $234 million relating to gains on revaluation of FX positions in Egypt and a hyperinflationary accounting adjustment in Ghana (the notable items). |
| The Group delivered a strong performance in the first quarter of 2025 amid an evolving economic environment. Operating income grew by 7 per cent to $5.4 billion. Excluding the impact of the notable items, operating income was up 12 per cent. Underlying expenses increased 5 per cent, resulting in positive income-to-cost jaws of 7 per cent, excluding the notable items. Credit impairment charges of $219 million in the quarter were equivalent to an annualised loan-loss rate of 25 basis points. This resulted in an underlying profit before tax of $2.3 billion, up 12 per cent, and a 19 per cent increase in underlying earnings per share. |
| The Group remains well capitalised and highly liquid with a diverse and stable deposit base. The liquidity coverage ratio of 147 per cent reflects disciplined asset and liability management. The Common Equity Tier 1 (CET1) ratio of 13.8 per cent remains robust post the impact of the full $1.5 billion share buyback announced in February 2025, with profit accretion in the first quarter partly offset by growth in risk-weighted assets (RWA). |
| Operating income of $5.4 billion increased by 7 per cent or 12 per cent excluding the two notable items. The growth was driven by record performance in Wealth Solutions and strong double-digit growth in Global Markets and Global Banking. |
| Net interest income (NII) increased 7 per cent, benefitting from improved mix and roll-off of legacy short-term hedges which was partly offset by impact of lower interest rates and margin compression. |
| Non NII increased 7 per cent or 18 per cent excluding the notable items. This was driven by continued momentum in Wealth Solutions with double-digit growth in both Investment Products and Bancassurance, and strong performances in both Global Banking from higher origination volumes and Global Markets driven by strong growth in both flow and episodic income. |
| Operating expenses increased 5 per cent. This was largely driven by continued investments into business growth initiatives and inflation, which were partly offset by efficiency savings. Excluding the notable items, the Group generated 7 per cent positive income-to-cost jaws, and the cost-to-income ratio remained unchanged at 54 per cent. |
| Credit impairment of $219 million increased d 24 per cent. The Wealth & Retail Banking charge of $179 million is broadly in line with recent quarters. Corporate and Investment Banking impairments continued to be well managed with a net charge of $30 million. Ventures' impairment was down by 64 per cent as delinquency rates improved in Mox Bank (Mox). The non-linearity charge increased by $23 million during the quarter, reflecting an increased probability weighting for the Global Trade and Geopolitical Trade Tensions scenario, given the heightened uncertainty around trade tariffs. |
| Other impairment charge decreased by $54 million to $6 million due to the non-repetition of software assets write-off. |
| Profit from associates and joint ventures increased by $28 million which mainly reflected higher profits at China Bohai Bank. |
| Restructuring, FFG, Debit Valuation Adjustment (DVA) and other items totalled $174 million including $73 million for Fit for Growth (FFG) programme charge and $97 million restructuring charges primarily relating to the simplification of technology platforms and loss on portfolio exits. |
| Taxation was $511 million on a reported basis, with an underlying effective tax rate of 23.7 per cent down from 26.5 per cent in the prior year due to lower level of losses in the UK, lower non-tax-deductible central Group costs and adjustments related to prior periods. |
| Underlying RoTE of 16.4 per cent increased 120 basis points due to higher profits and lower taxation partly offset by higher tangible equity. On a reported basis, RoTE increased 130 basis points to 14.8 per cent with growth in underlying profits partly offset by Restructuring and FFG CTA. |
| Underlying basic earnings per share (EPS) increased 9.8 cents or 19 per cent to 62.7 cents, and reported EPS increased 10.1 cents or 22 per cent to 56.6 cents, reflecting both the increase in profits and reduction in share count as a result of successfully executing share buyback programmes. |
| For the full document, click the link below |
| Standard Chartered |
| Stay ahead of the curve! Subscribe to InsidEntity for daily updates on all your favourite companies. |