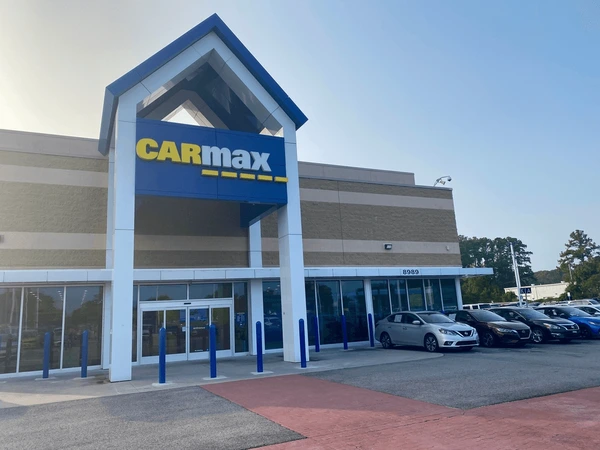
| CarMax, Inc. (NYSE: KMX) today reported results for the third quarter ended November 30, 2024. |
| Third Quarter Highlights: (1) |
- Retail used unit sales increased by 5.4% and comparable store used unit sales increased by 4.3%; wholesale units increased by 6.3%.
|
- Total gross profit of $677.6 million increased 10.6% driven by unit volumes and strong unit margin performance.
|
-
- Gross profit per retail used unit of $2,306, in line with the prior year’s third quarter
|
-
- Gross profit per wholesale unit of $1,015, up $54 per unit
|
-
- Extended Protection Plans (EPP) margin per retail unit of $573, an increase of $53 per unit
|
-
- Service margin growth of $60 per retail unit
|
- Bought 270,000 vehicles from consumers and dealers, an increase of 7.9%
|
-
- 237,000 vehicles were purchased from consumers, up 4.1%
|
-
- 33,000 vehicles were purchased through dealers, up 46.7%
|
- SG&A of $575.8 million increased 2.8%. Ongoing cost management efforts supported strong leverage in SG&A as a per cent of gross profit.
|
- CarMax Auto Finance (CAF) income of $159.9 million, an increase of 7.6%, due to growth in CAF’s net interest margin percentage and average managed receivables. The provision for loan losses reflected performance largely in line with expectations set at the end of this year’s second quarter.
|
- Net earnings per diluted share of $0.81 increased 55.8% from $0.52 a year ago.
|
- Repurchased $114.8 million in shares of common stock in the third quarter of fiscal year 2025.
|
| (1) Comparisons to the prior year’s third quarter unless otherwise stated |
CEO Commentary : |
| “I am pleased with the positive momentum that we are driving across our diversified business model. Our solid execution and a more stable environment for vehicle valuations enabled us to deliver robust EPS growth driven by increases in unit sales and buys, solid margins, growth in CAF income, and ongoing management of SG&A,” said Bill Nash, president and chief executive officer. “Our associates and our best-in-class omni-channel experiences are key differentiators that enable our success. We are excited to leverage the capabilities we have built to drive growth as we access the largest total addressable market within our industry.” |
| Third Quarter Business Performance Review : |
| Sales. Combined retail and wholesale used vehicle unit sales were 320,256, an increase of 5.8% from the prior year’s third quarter. |
| Total retail used vehicle unit sales increased 5.4% to 184,243 compared to the prior year’s third quarter. Comparable store used unit sales increased 4.3% from the prior year’s third quarter. Total retail used vehicle revenues increased 1.2% compared with the prior year’s third quarter, driven by the increase in retail used units sold, partially offset by the decrease in average retail selling price, which declined approximately $1,100 per unit or 3.9%. |
| Total wholesale vehicle unit sales increased 6.3% to 136,013 versus the prior year’s third quarter. Total wholesale revenues increased 0.3% compared with the prior year’s third quarter, driven by the increase in wholesale units sold, partially offset by the decrease in the average wholesale selling price of approximately $500 per unit or 5.7%. |
| We bought 270,000 vehicles from consumers and dealers, up 7.9% compared to last year’s third quarter. Of these vehicles, 237,000 were bought from consumers and 33,000 were bought through dealers, an increase of 4.1% and 46.7%, respectively, from last year’s third quarter. |
| Other sales and revenues increased by 9.7% compared with the third quarter of fiscal 2024, representing an increase of $14.6 million, primarily reflecting an increase in EPP revenues resulting from stronger margins. |
| Online retail sales (2) accounted for 15% of retail unit sales, compared to 14% in the third quarter of last year. Revenue from online transactions (3), including retail and wholesale unit sales, was $2.0 billion, or approximately 32% of net revenues, up from 31% in last year’s third quarter. |
| Gross Profit. Total gross profit was $677.6 million, up 10.6% versus last year’s third quarter. Retail used vehicle gross profit increased 6.8% and retail gross profit per used unit was $2,306, in line with last year’s third quarter. |
| Wholesale vehicle gross profit increased 12.3% versus the prior year’s third quarter. Gross profit per unit increased $54 from the prior year’s third quarter to $1,015. |
| Other gross profit increased 24.6% primarily reflecting growth in EPP revenues resulting from stronger margins as well as service gross profit driven by cost coverage measures, increased efficiencies, and positive retail unit growth. |
| SG&A . Compared with the third quarter of fiscal 2024, SG&A expenses increased 2.8% or $15.8 million to $575.8 million, primarily driven by an increase in compensation and benefits due to year-over-year corporate bonus accrual dynamics. Partially offsetting this was a decrease in advertising spend due to timing. SG&A as a percentage of gross profit decreased 640 basis points to 85.0% in the third quarter compared to 91.4% in the prior year’s third quarter, driven by the growth in gross profit and ongoing cost management efforts in the stores and customer experience centres. |
| CarMax Auto Finance. (4) CAF income increased 7.6% to $159.9 million driven by growth in CAF’s net interest margin percentage and average managed receivables. This quarter’s provision for loan losses was $72.6 million compared to $68.3 million in the prior year’s third quarter. |
| As of November 30, 2024, the allowance for loan losses of $478.9 million was 2.70% of ending managed receivables, down from 2.82% as of August 31, 2024. The allowance for loan losses was down from 2.92% a year ago, due to the effect of the previously disclosed tightening of CAF’s underwriting standards. |
| CAF’s total interest margin percentage, which represents the spread between interest and fees charged to consumers and our funding costs, was 6.2% of average managed receivables, up from the prior year’s third quarter but consistent with this year’s second quarter. After the effect of 3-day payoffs, CAF financed 43.1% of units sold in the current quarter, down slightly from 44.0% in the prior year’s third quarter. CAF’s weighted average contract rate was 11.2% in the quarter, down from 11.3% in the third quarter of last year. |
| Share Repurchase Activity. During the third quarter of fiscal year 2025, we repurchased 1.5 million shares of common stock for $114.8 million. As of November 30, 2024, we had $2.04 billion remaining available for repurchase under the outstanding authorization. |
| Location Openings. During the third quarter of fiscal 2025, we opened one new store location in Alliance, Texas. |
| (2) |
An online retail unit sale is defined as a sale where the customer completes all four of these major transactional activities remotely: reserving the vehicle; financing the vehicle, if needed; trading in or opting out of a trade-in; and creating a remote sales order. |
| (3) |
Revenue from online transactions is defined as revenue from retail sales that qualify for an online retail sale, as well as any EPP and third-party finance contribution, wholesale sales where the winning bid was an online bid, and all revenue earned by Edmunds. |
| (4) |
Although CAF benefits from certain indirect overhead expenditures, we have not allocated indirect costs to CAF to avoid making subjective allocation decisions. |
We will host a conference call for investors at 9:00 a.m. ET today, December 19, 2024. Domestic investors may access the call at 1-800-225-9448 (international callers dial 1-203-518-9708). The conference I.D. for both domestic and international callers is 3171396. A live webcast of the call will be available on our investor information home page at investors.carmax.com. |
| A replay of the webcast will be available on the company’s website at investors.carmax.com through April 9, 2025, or via telephone (for approximately one week) by dialling 1-800-839-2456 (or 1-402-220-7216 for international access) and entering the conference ID 3171396. |
| Fourth Quarter Fiscal 2025 Earnings Release Date |
| We currently plan to release results for the fourth quarter ending February 28, 2025, on Thursday, April 10, 2025, before the opening of trading on the New York Stock Exchange. We plan to host a conference call for investors at 9:00 a.m. ET on that date. Information on this conference call will be available on our investor information home page at investors.carmax.com in late March 2025. |
| About CarMax |
| CarMax, the nation’s largest retailer of used autos, revolutionized the automotive retail industry by driving integrity, honesty and transparency in every interaction. The company offers a truly personalized experience with the option for customers to do as much, or as little, online and in-store as they want. During the fiscal year ending February 29, 2024, CarMax sold approximately 770,000 used vehicles and 550,000 wholesale vehicles at its auctions. In addition, CarMax Auto Finance originated more than $8 billion in receivables during fiscal 2024, adding to its more than $17 billion portfolio. CarMax has over 245 store locations, and nearly 30,000 associates, and is proud to have been recognized for 20 consecutive years as one of the Fortune 100 Best Companies to Work For®. CarMax is committed to making a positive impact on people, communities and the environment. Learn more in the 2024 Responsibility Report. For more information, visit www.carmax.com |
| For the full document click the link below: |
| CarMax, Inc. |
| Stay ahead of the curve! Subscribe to InsidEntity for daily updates on all your favourite companies. |